Brazil becomes less equal, South Africa gets more unequal

Inequality can be reduced

, via Wikimedia Commons “]Brazil has a remarkable achievement, as it has reduced inequality over the last decade, as shown in the chart below. The exact reasons for the reduction in inequality is hotly debates in Brazil, as are the methods of calculating inequality. There are sceptics on this outcome, and those praising this achievement. Just so that we are clear – Brazil remains a very unequal society. South Africa has however become more unequal, and this fact is not disputed with official development indicators broadly agreeing with this finding. The chart below shows data from The World Bank for the Gini Coefficient. We have selected the BRICS countries to represent here, but the focus is Brazil and South Africa. It suggests that over a short period of time, inequality can be reduced, in an environment which reduces poverty and increases jobs. (I have added a note to the editorial calendar for Zapreneur, as it would be informative to better understand the reasons behind the outcomes.)

Lulismo

One debate that is emerging on explaining Brazil’s outcomes is occurring under the moniker “Lulismo”. The word derives from the name of President Lula, and seeks to explain the choices that were made by Brazil during that period. It however also suggests that there might be doubts of future leaders being able to replicate the gains capable under a leader, like President Lula. The debate however is largely conducted in Portuguese, which means that the textures and nuances of the debate cannot be fully comprehended by someone that does not speak Portuguese.
The features of the debate that we could glean ask a couple of demanding questions:

  1. Is the reduction of inequality a small victory for moving a leftist programme to the centre? The suggestion being that a more egalitarian outcome could have been achievable.
  2. Are the results simply derived from a commodity boom and will prove short-lived in an economic downturn?
  3. Are Brazil outcomes rather the product of a longer run reform programme, which included neo-liberal restructuring under previous administrations?
  4. Are the Brazilian outcomes the result of a developmental state, which saw the Workers Party (PT) introduce social and economic measures that are the cornerstone of the success?

The debate seems furious and polarised. The underlying question is one that South Africa would love to have -Why has our society become more equal, and can we sustain it over the longer term?
 

Read more

Brics – Human Development Index Comparisons

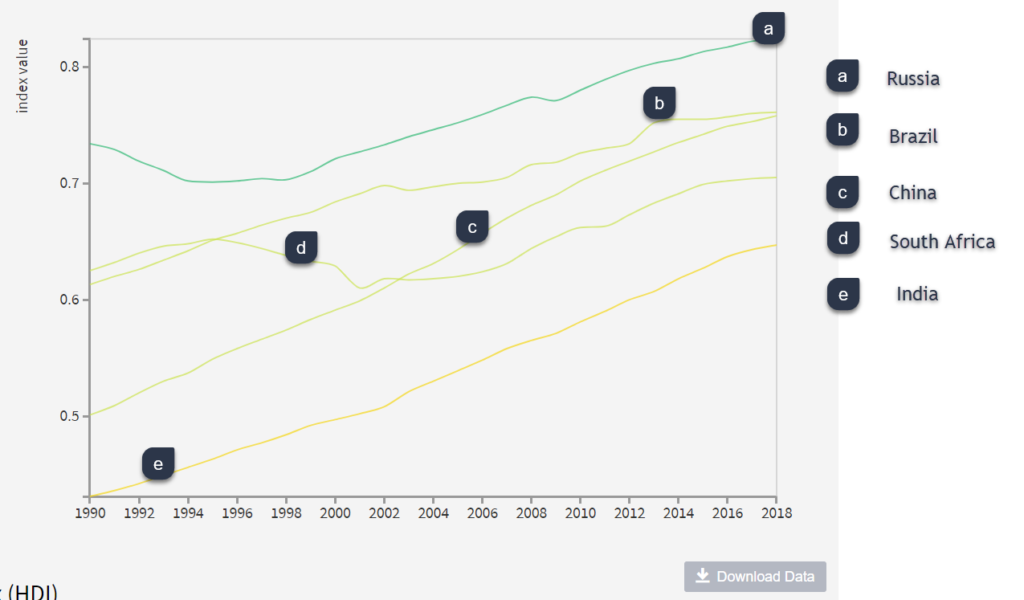
Recent discussions in the media has focussed on whether South Africa belongs in the exclusive BRICS (Brazil, Russia, India, China and South Africa) group of countries. Over the last year I have increasingly been looking to Brazil and India as examples of what might be possible. The improvements in the Human Development Index (HDI) of these countries suggests we can learn a great deal from them. Of course, in Brazil and India there are disputes on the numbers, however the take home is this – South Africa’s HDI has fallen primarily due to poor health outcomes, which are associated with the impact of HIV/Aids. Our educational performance has also been weak. The silver lining is that current initiatives by government in the health and education sectors have better prospects for success, than our first policy choices after 1994.

The table below has been updated with data till 2018.

Human Development Index – Brazil, South Africa, China, Russia and India

The chart shows the Human Development Index (HDI) for the BRICS countries (i.e. Brazil, Russia, India and South Africa) from 1980 to 2018. The data shows that Russia, India and Brazil have improved their HDI, whilst South Africa has seen a decline in its HDI since the mid-1990s. It underscores the point, that we must be learning more from the experiences in Russia, but especially from Brazil and India.

At first glance South Africa’s performance looks exceptionally weak. To better understand the outcomes, it is important to look at the components that make up the HDI.


This page may take a few seconds to load as it extracts the charts from Public Data Explorer
The HDI is a composite index measuring average achievement in three basic dimensions of human development—

Read more

Educational Failures – Are Trade Unions Too Blame?

Andile Lungisa’s – Chairperson of the National Youth Development Agency and  ANCYL leader – call for the de-unionisation of teaching has sparked a furore. The arguments focus on the constitutional right for workers to belong to organisation, and that focus must be placed on the real problems facing education. I however argue that the problems in labour relations in the education lies not only with the trade unions, but with government, who have not fulfilled their responsibility as an employer.
Improving education in South Africa is the most important priority in South Africa. When I look at our results on the international benchmark examinations, I am angry with us as a society. We have literally failed a generation of children in South Africa. To put it bluntly, we perform very poorly on the international examinations, with some assessments of the results placing last in the world for performance on the Mathematics examinations. We are facing a crisis in education, and we must act.
Instead of acting to resolve the situation, there is this constant repetition that the trade unions are too blame. Here are a couple of refrains I have heard over the last few weeks:

Read more

MTBPS – Adjustments and allocations, but who benefits?

The MTBPS primary aim is to state the policy direction that government has taken. However, as part of the MTBPS there are adjustments made to budgets which provide us with an indication of how government uses these adjustments to support its objectives.  Here is the run down of the major adjustments to the 2011/12 budget.

Government will spend about 9 billion less than anticipated

The National Treasury notes that

Taking into account funding set aside in the contingency reserve at the time of the 2011 Budget, projected underspending, savings declared by departments and the adjusted state debt cost estimate, the revised estimate of total expenditure in 2011/12 is R888.0 billion. In February 2011 at the tabling of the budget, provision was made for expenditure of R888.9 billion for 2011/12. (Page 34, MTBPS, 2012)

Under spending by government departments has largely come under control, but with local government’s still struggling to spend funds on infrastructure and other projects. Spending performance by government has however improved over the years, but this remains an area that needs to be urgently tackled. In an environment of low economic growth, there could have been a range of ways to spend all or part of the R 9 billion budgeted. For instance, additional funding could have been provided to the Jobs Creation Trust or to a number of other programmes.


Read more

Less government spending, and what the National Treasury intends doing to improve the situation

Does the MTBPS have the right toolkit?

Minister Pravin Gordhan in previous budgets put in place a counter-cyclical strategy to support South Africa due to the impacts of the global financial crises. The recovery in the South African economy has not been as robust as anticipated raising significant challenges. Our economic growth is sluggish and non-interest spending is declining, painting a worrying picture going forward.

Economic Growth

South Africa’s economic growth is more like the developed world, than emerging economies, according to the MTBPS. South Africa is thus projected to underperform in comparison to its peers in other emerging economies and lags behind developing Asia. The choices made by government in the MTBPS will unfortunately continue this trajectory.

Read more

MTBPS-More continuity, when change is needed

The National Treasury argues that:

The measure of a strategy is not in the breadth of objectives it seeks to address, but rather in its focus on those objectives that really matter. Fiscal constraints force government to choose carefully between competing objectives.

Does the MTBPS have the right toolkit?

This provides a benchmark against which to assess the Medium-Term Budget Policy Statement (MTBPS). The common sense approach is to focus on the level of the deficit. On the one hand, the financial markets will welcome the attempts to reduce the deficit over the medium term, whilst raising concerns about the current perception that debt is high. On the other hand, civil society organisations will argue that more needs to be done, but the deficit will be an indicator that government is attempting to do something during this downturn. There are important public policy choices in this debate, with the National Treasury providing an important input in the Fiscal Guidelines.
However, there is a foundational question – Are the objectives the right one’s? Or more crisply, is the underlying strategy the correct one? To place, this in context South Africa lags behind its peers in terms of economic growth.

Read more

Economic Freedom and Fiscal Policy – Previewing the Medium-Term Budget Policy Statement 2011

Does the MTBPS have the right toolkit?

As Minister Pravin Gordhan delivers governments Medium-Term Budget Policy Statement (MTBPS) for 2011, the debate on economic transformation is gathering pace. In the same week, as the MTBPS is announced both the African National Congress Youth League (ANCYL) and the Young Communist League (YCL) will hold events focussed on economic transformation. These are separate events, and speak to the broader political positioning that sadly is becoming a permanent feature of the African National Congress.
The strategists at the National Treasury will have to consider these events, but will also have to look towards how the market will react.  The biggest challenge is that rating agencies have raised concerns about the level of government debt. Whatever one may think of the ratings agencies – who contributed to the global financial crises by providing good ratings to dubious investments – they wield power within the market, which in turn impacts on investment choices. Moreover, South Africa will be borrowing to finance primarily the expansion of power stations, but potentially in other areas as well. In other words, the perceptions of rating agencies and larger private companies matter. Their opinion should matter less, but the reality is that they have a powerful set of mechanisms to influence public policy and to ultimately impact on economic growth.

Read more

Youth subsidy – Bringing education into the picture

The debate on youth subsidy has gathered pace. The arguments for a youth subsidy consist of two major arguments.
First, the high rates of unemployment amongst youth are exceedingly worrying. As shown in a previous chart on Zapreneur. The key features of the unemployment data by age, show that:
The key features of the data include that:

  • The biggest proportion of unemployed are concentrated in the age groups 15-24 years (29.5%) and 25-34 years (42.8%).
  • Unemployment for those 34 years old and younger accounts for 72,3% of unemployed South Africans.

Youth unemployment thus is a serious challenge, and perhaps the defining challenge that we face.

Read more